Introduction
Welcome to an Introduction to GIS & Remote Sensing! This workshop will give an overview of remote sensing and explore some methods for accessing and analyzing remote sensing data. To start off, this section will cover a number of fundamental remote sensing concepts and provide a snapshot of key satellites and sensors to be aware of throughout the next few modules.
Pre-workshop Set-up
- Install QGIS if not already installed.
- Create an Earth Explorer account.
- Download and upzip the data folder for the lesson. Save the upzipped folder on your Desktop. Make sure the folder is named
intro-rs-data.
Objectives
- Understand how remote sensing satellite data is collected and stored.
- Differentiate between spatial and temporal resolution.
- Learn key facts about the most commonly used satellites and sensors.
Data Collection
What is remote sensing? Remote sensing is the process of gaining information about an object or an area without directly being in contact with that object. This method allows scientists to collect data across very wide distances or in inaccessible areas at regular intervals in order to monitor and map changes over time. The level of detail, accuracy, and frequency of the data collected depends on the satellite and sensor that was used to collect it.
How is the data collected? Satellites carry one or more sensors that measure the level of electromagnetic radiation coming from the Earth and its atmosphere. The level changes based on different atmospheric and surface conditions. Those variations give us information about the atmospheric and surface conditions within the Earth’s system.
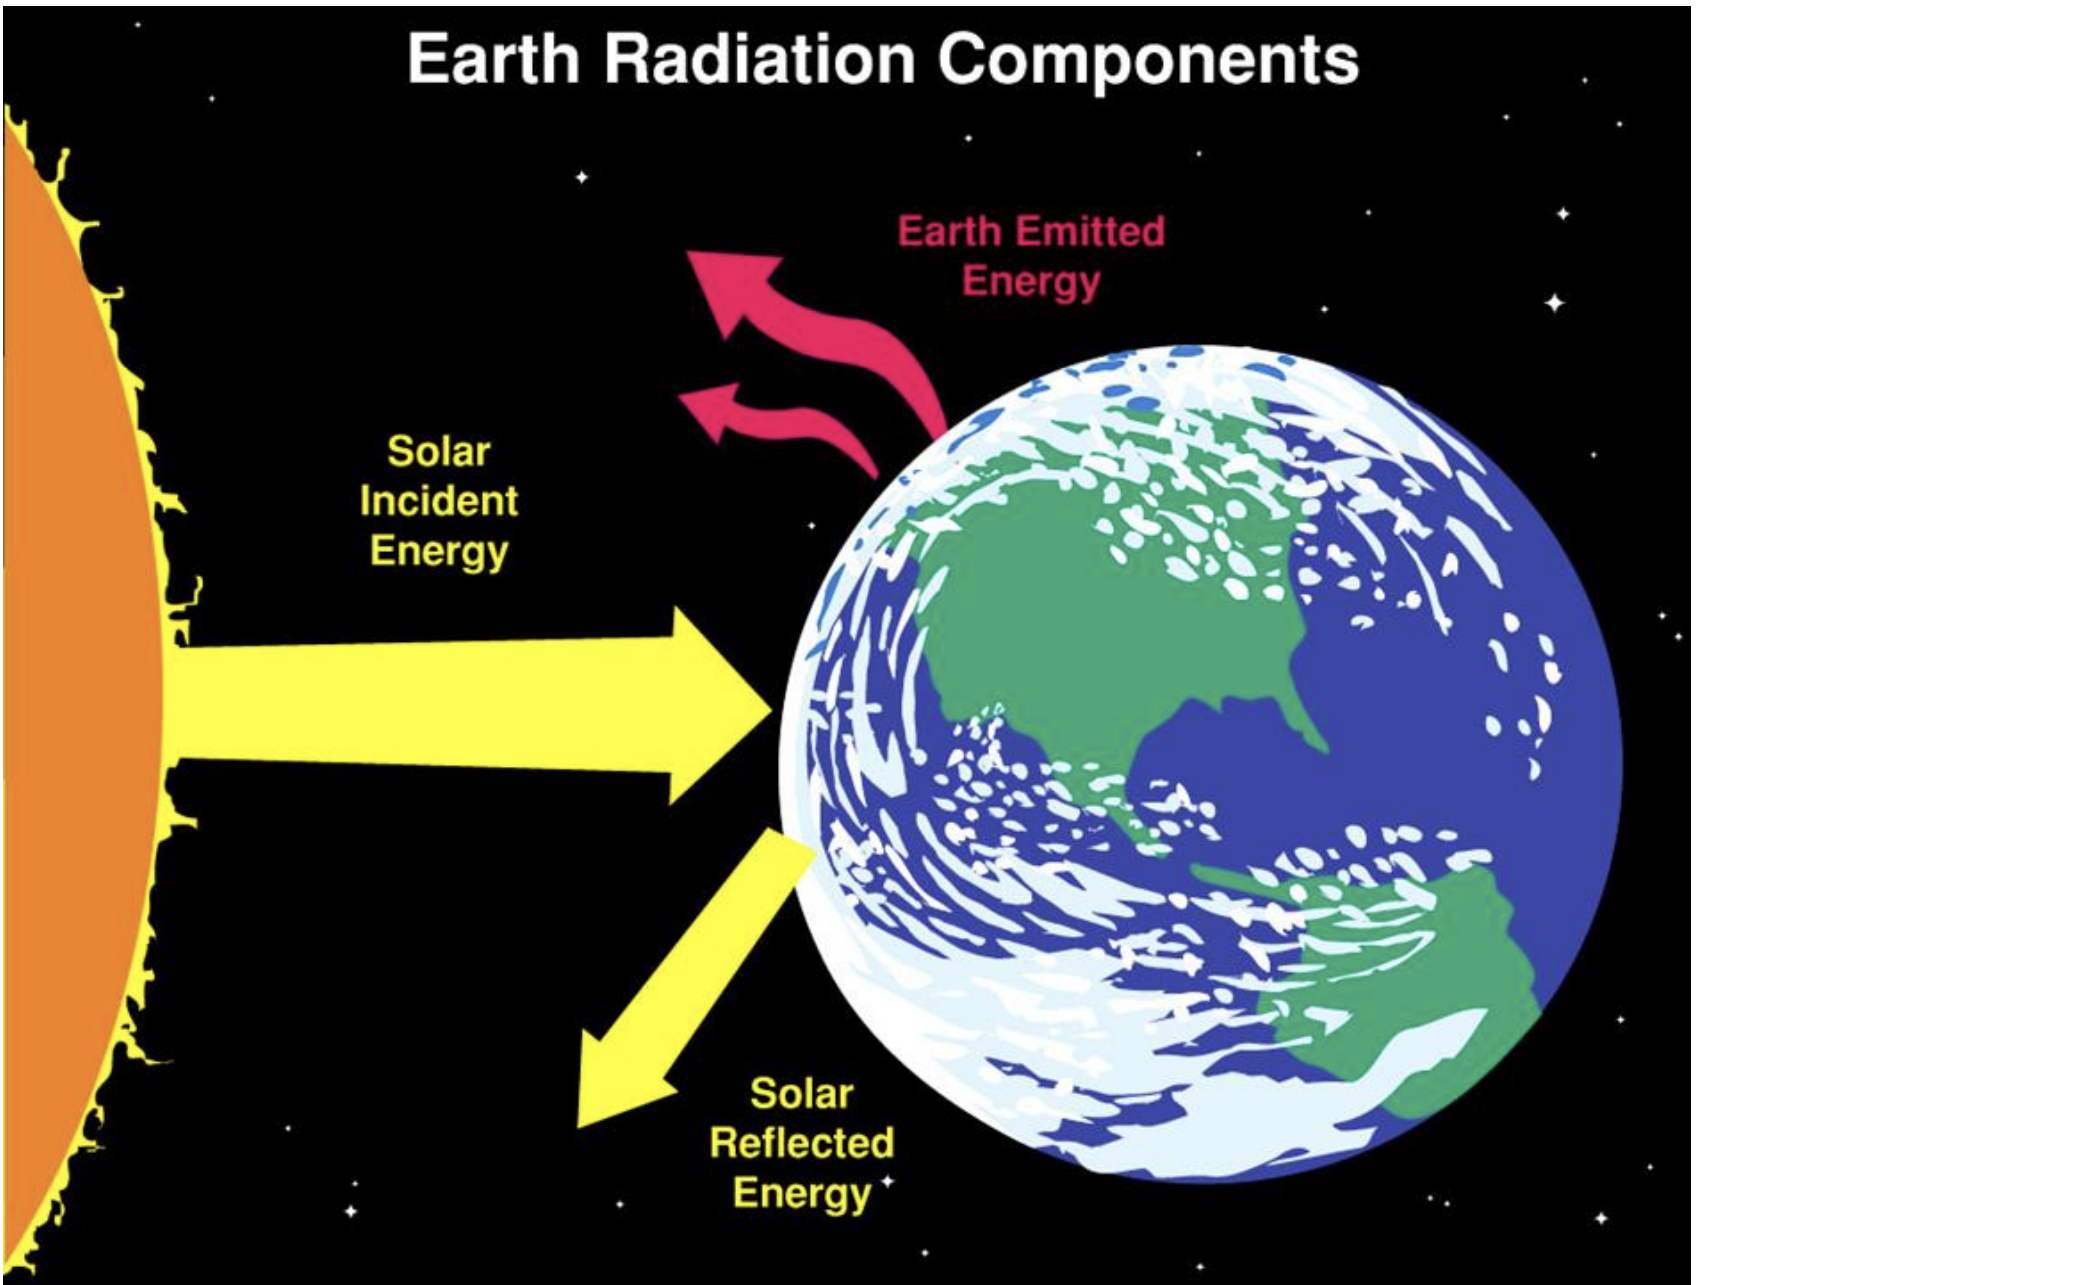
Figure 1. Earth radiation components. Image source: NASA ARSET.
All radiation, or electromagnetic energy, travels in waves or varying sizes. Those differences can be viewed on the electromagnetic spectrum below.
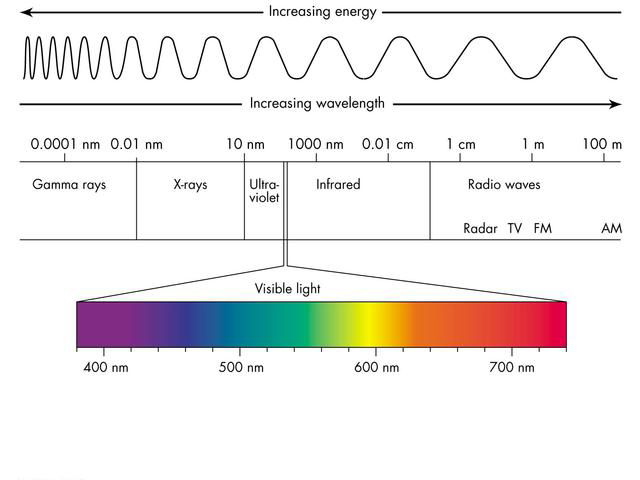
Figure 2. Electromagnetic spectrum. Image source: Google sites.
The radiation that sensors measure come in two primary forms:
- Reflected solar radiation
- Emitted infrared and microwave radiation
Different types of objects will absorb and emit energy at different wavelengths. A common example is that of healthy, green vegetation: red and blue wavelengths are absorbed, while green and infrared wavelengths are reflected or emitted back. The amount of energy that is reflected or emitted differs between objects as well. Snow, for instance, reflects up to 90% of solar radiation, while the ocean only reflects around 6%. In exchange, the ocean emits far more infrared radiation than snow, since most of the energy that is absorbed gets re-emitted. All of these differences make up an object’s unique spectral signature that can be measured and used for further analysis.
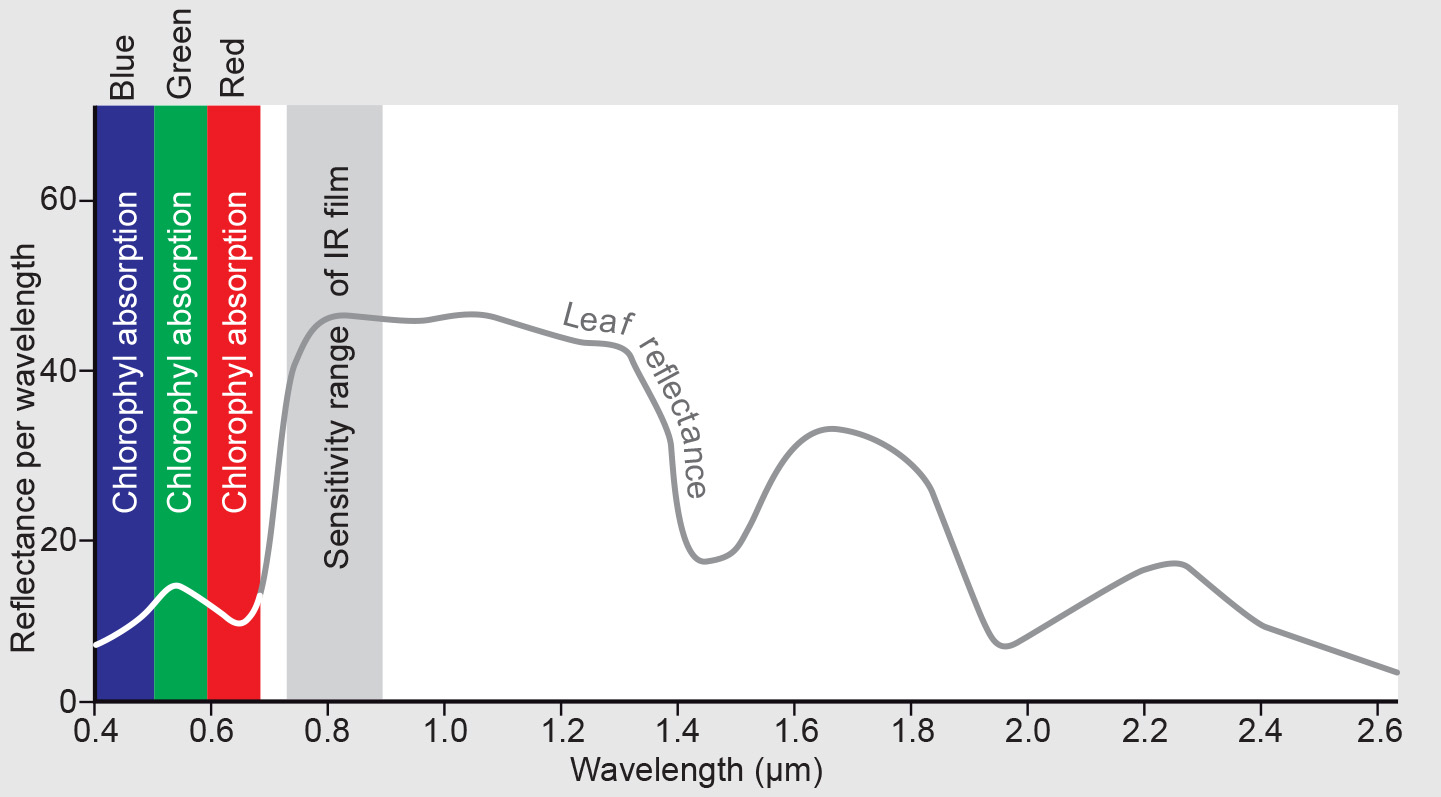
Figure 3. Spectral signature of vegetation. Image source: Living Textbook, ITC, University of Twente.
Passive vs. active measurements. Sensors can either be passive or active: passive sensors use energy from the sun to measure reflected energy, while active sensors provide their own source of energy to take measurements. Passive sensors tend to operate within the visible, infrared, thermal infrared, and microwave (shortwave) portions of the electromagnetic spectrum and measure indices such as sea surface temperature, water quality, vegetation, and cloud properties. These sensors, however, experience challenges with penetrating cloud cover. Active sensors mainly operate in the microwave (longwave) portion of the electromagnetic spectrum. Radar and lidar are the most common examples of these types of sensors and are useful for measuring features such as elevation. These sensors can be used in the day or night and can penetrate cloud cover, but are more challenging to process and may have limited availability. The remainder of the lesson and the next few workshops will focus on passive remote sensing.
Resolution
What are the different types of resolution? Resolution defines particular characteristics of a satellite that can help determine the effectiveness of its use in different scientific applications. There are two fundamental types of resolution: (1) Spatial resolution determines the level of detail that the satellite captures in each pixel measurement. For example, if a satellite has a resolution of 30 meters, that means that each pixel covers a 30 meter by 30 meter surface area. (2) Temporal resolution indicates the frequency with which the satellite collects its data for the same location. A satellite with a temporal resolution of 5 days collects new imagery at a given location every 5 days. Temporal resolution is often referred to as “revisit time,” and spatial resolution is simply called “resolution.”
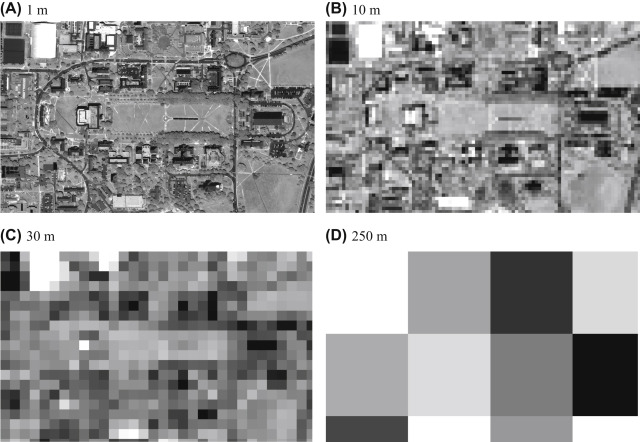
Figure 4. Gridded image indicating difference between high and low resolution. Image source: Liang & Wang, 2020
Coarseness. Satellites can have low, moderate, or high spatial and temporal resolution. A satellite with a high spatial resolution does not mean it will also possess a high temporal resolution, and vice versa. In fact, with many of the freely available NASA Earth observations, it is difficult to get both a high spatial and temporal resolution, as high spatial resolution requires a narrower swath, which results in a less frequent revisit time. While there are no definitive numerical ranges for the different resolution levels, the suggestions below give an idea of what values are generally considered to fall into low, moderate, or high spatial and temporal resolution categories:
- Spatial
- Low: > 100 meters
- Moderate: 15-100 meters
- High: < 15 meters
- Temporal
- Low: > 5 days
- Moderate: 3-5 days
- High: < 3 days
How Data is Stored
Storage depends on the data type. There are four general types of passive remote sensing imagery: visible, infrared, multispectral, and hyperspectral Visible data is made up of pixels that fall within the red, green, or blue wavelengths. Those pixels are then stored in one of three corresponding red, green, or blue bands within a raster image. Infrared imagery expands upon visible imagery by including pixels within the infrared range of the spectrum that are stored in separate bands. Multispectral raster imagery is usually made up of 7-12 bands that include the visible bands and multiple infrared bands across the electromagnetic spectrum. Hyperspectral data contains the most amount of detail, as those raster images can be made up of hundreds of narrow bands across the electromagnetic spectrum.
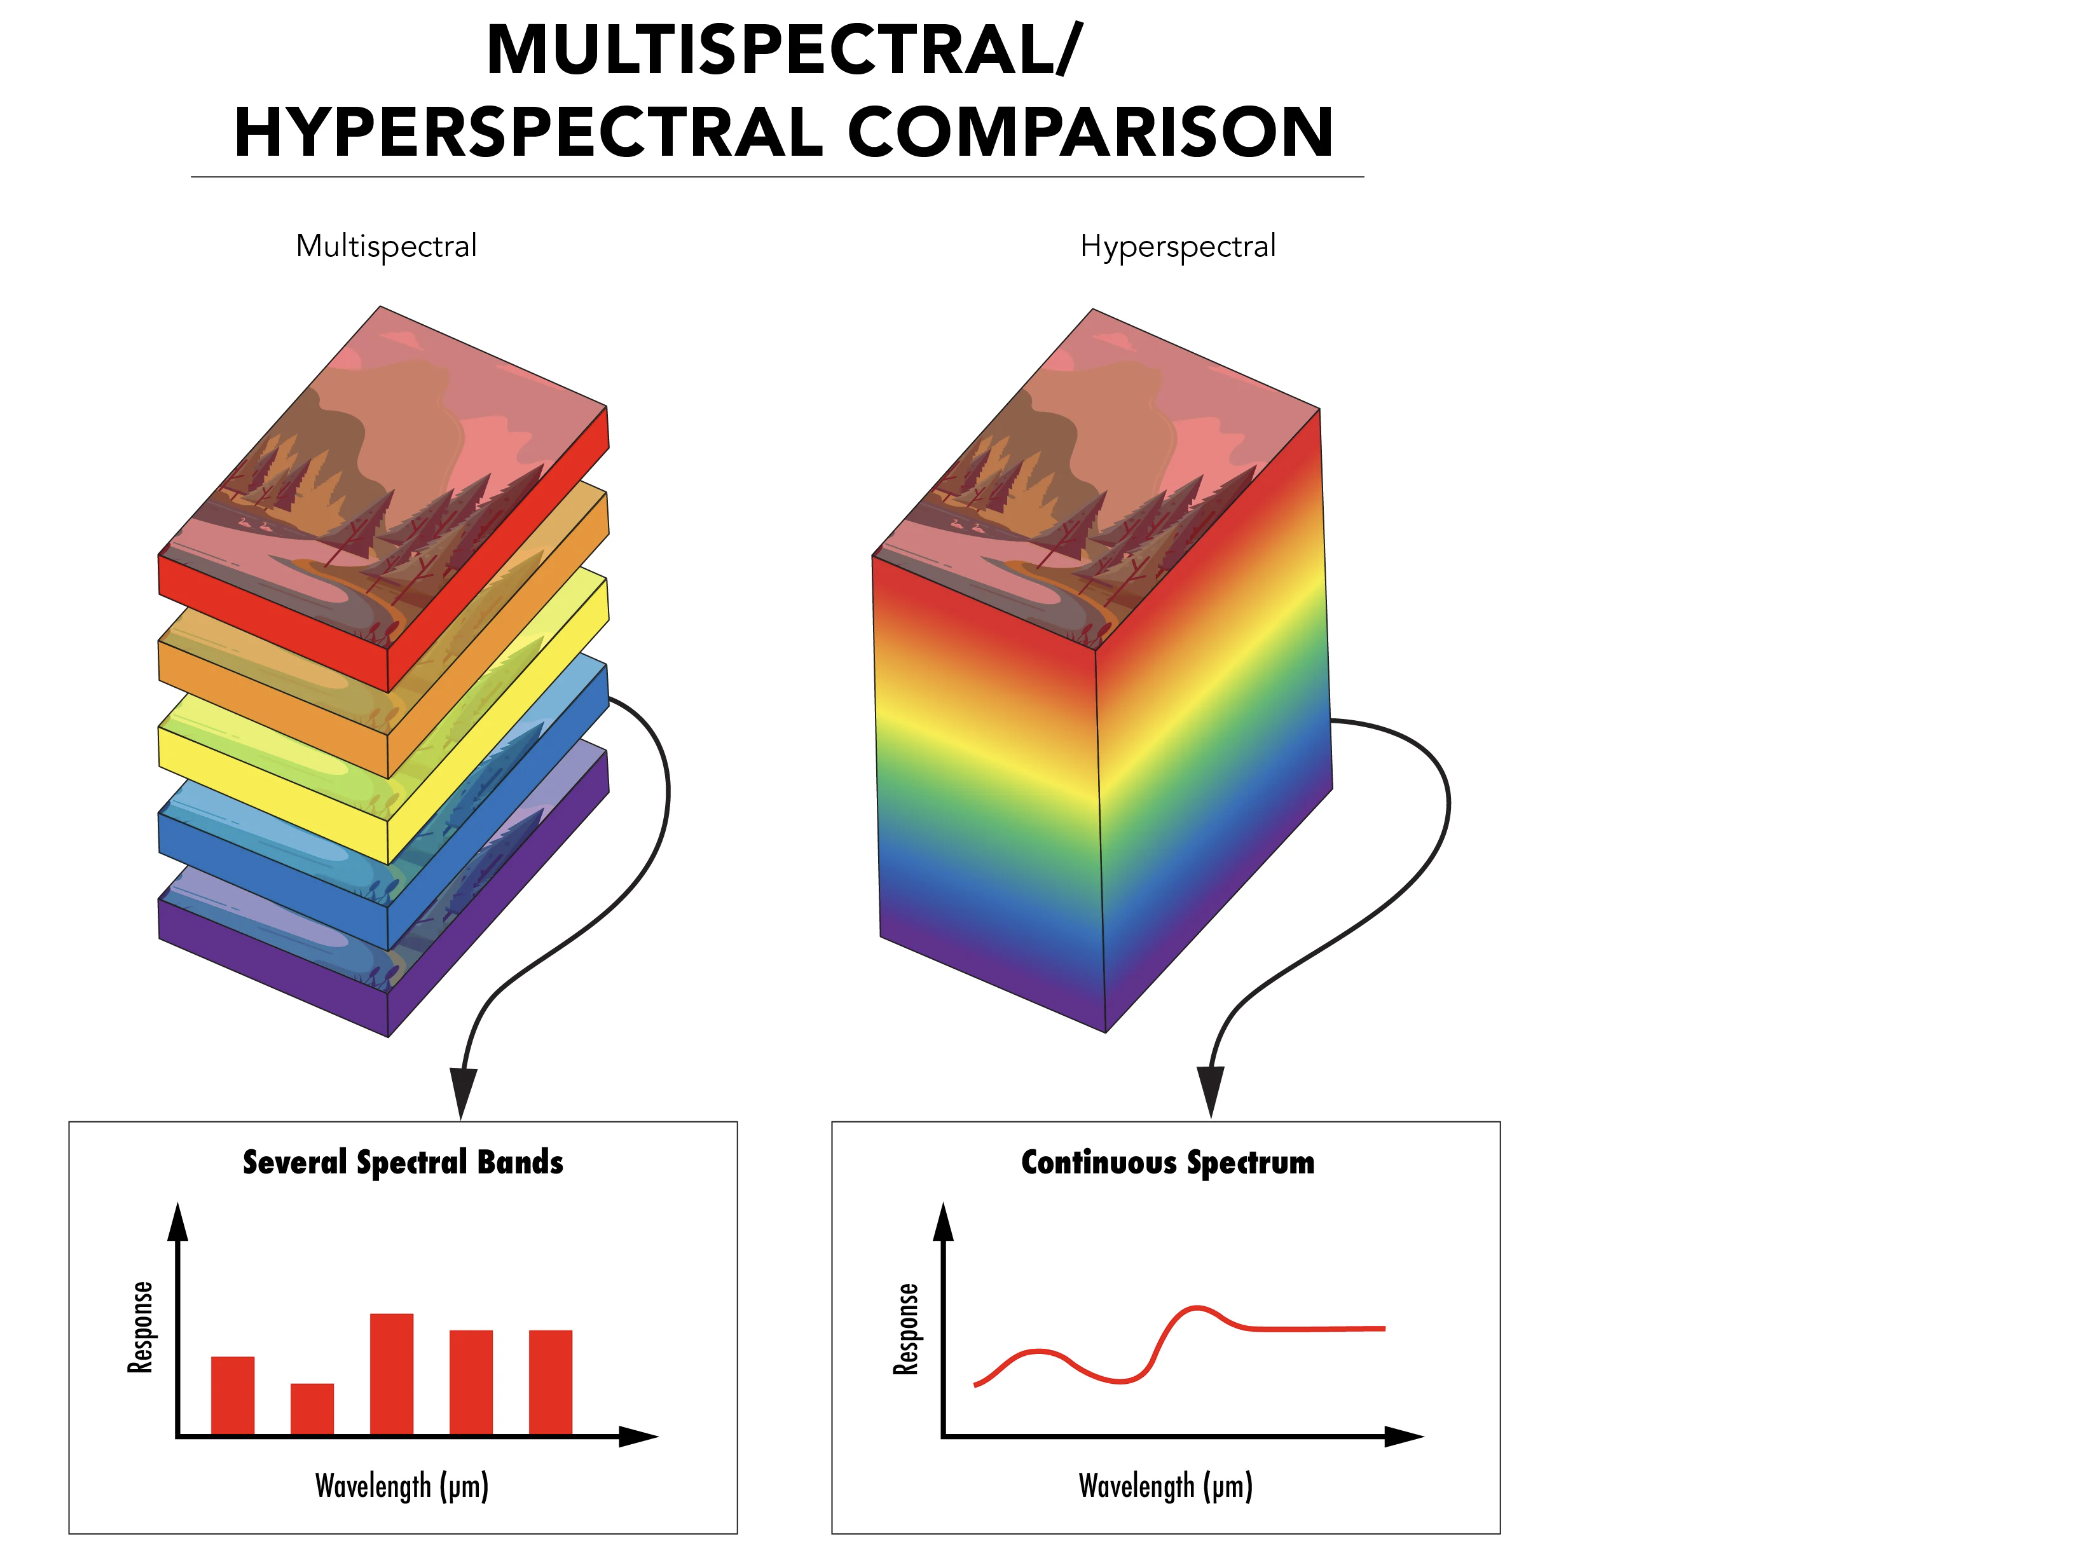
Figure 5. Multi- vs. hyperspectral band. Image source: Hyperspectral and Multispectral Imaging, Edmund Optics, 2022
The values stored in these bands are accessed and analyzed using different tools that we will cover in the next few workshops.
Key Satellites and Sensors
A number of these satellites and sensors are particularly useful for hydrologic applications.
| Satellite | Sensor | Dates | Resolution | Revisit Time | Provider |
|---|---|---|---|---|---|
| Landsat 4, 5 | TM | 1982 - 2013 | 30 m | 16 days | NASA/USGS |
| Landsat 7 | ETM+ | 1999 - 2022 | 30 m | 16 days | NASA/USGS |
| Landsat 8 | OLI/TIRS | 2013 - present | 30 m | 16 days | NASA/USGS |
| Landsat 9 | OLI-2/TIRS-2 | 2021 - present | 30 m | 16 days | NASA/USGS |
| Sentinel-2 | MSI | 2015 - present | 10 m | 5 days | ESA |
| Terra, Aqua | MODIS | 2000 - 2025 | 250 m - 1 km | 1 day | NASA |
| Suomi NPP | VIIRS | 2013 - present | 375-750 m | 1 day | NASA |
| PlanetScope | PS2/PS2.SD | 2016 - present | 3 m | 1 day | Planet |
| GPM | GMI, DPR | 2014 - present | 10 km | 1-2 hours | NASA/JAXA |
| SMAP | Soil Moisture Active Passive | 2015 - present | 3 km | 3 days | NASA |
| GRACE | Gravity Recovery and Climate Experiment | 2002 - present | 300-400 km | 1 month | NASA |
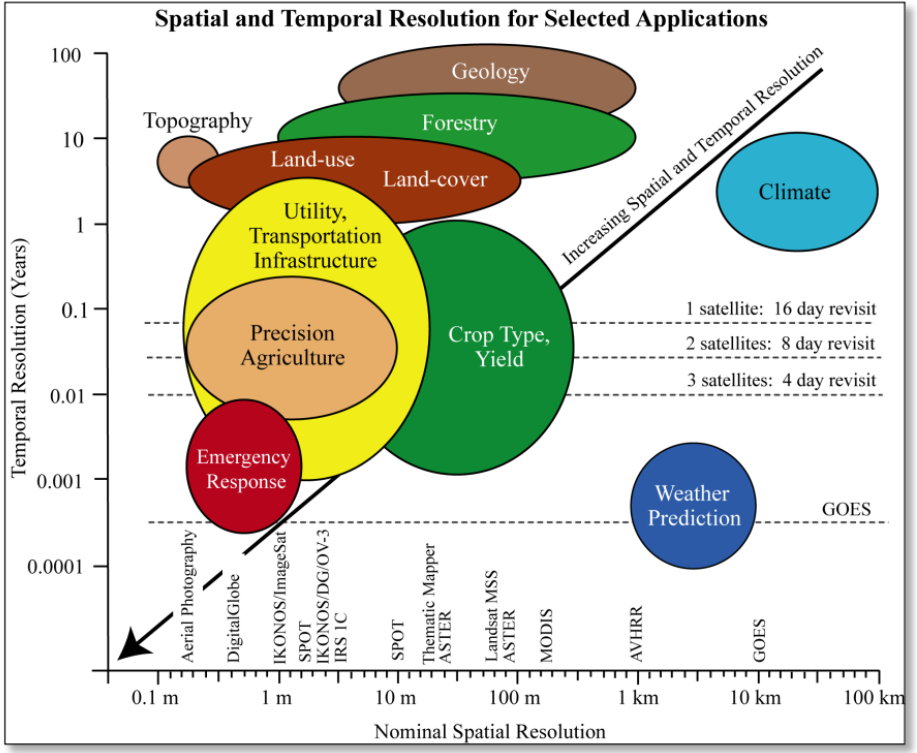
Figure 6. Example of Applications. Image source: University of Maryland