Satellite images in GEE - Browsing & pre-processing
This exercise will walk us through retrieving and visualizing Landsat 8 data collections. Create a new repository called ‘training-servir-gee’.
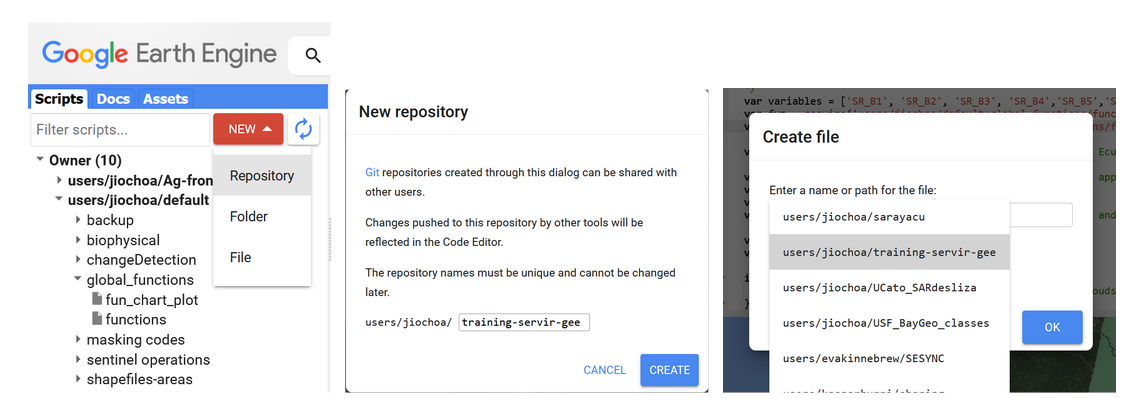
Figure 3. Creating a new script.
We set the name for our new script ‘sat_image_processing’.
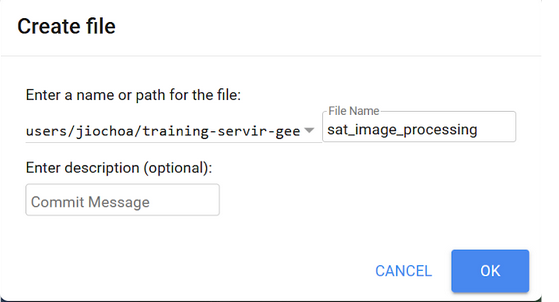
Figure 4. Naming a new script
We look for Landsat 8 surface reflectance (SR) Collection 2 Tier 1 data. Collection 1 is already deprecated and Tier 1 comprises the highest radiometric and terrain correction quality.
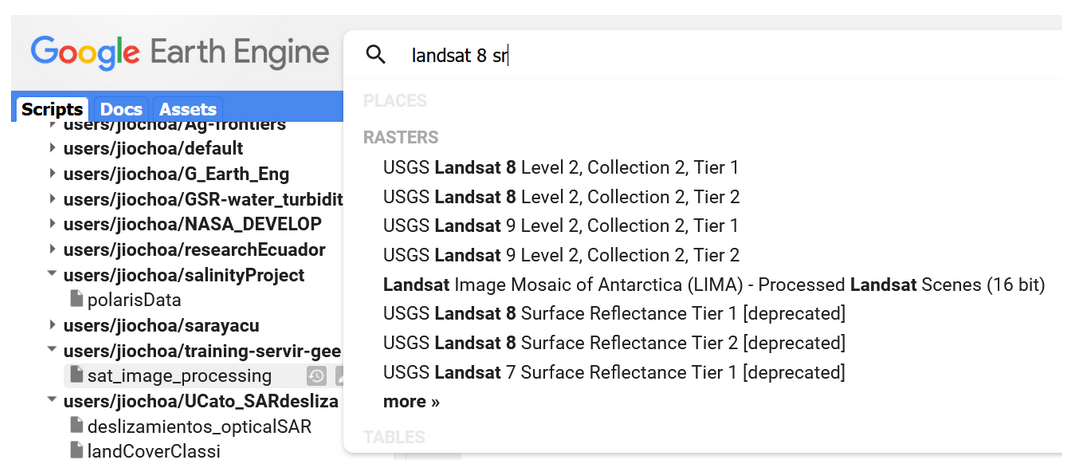
Figure 5. Catalog search bar showing Landsat datasets.
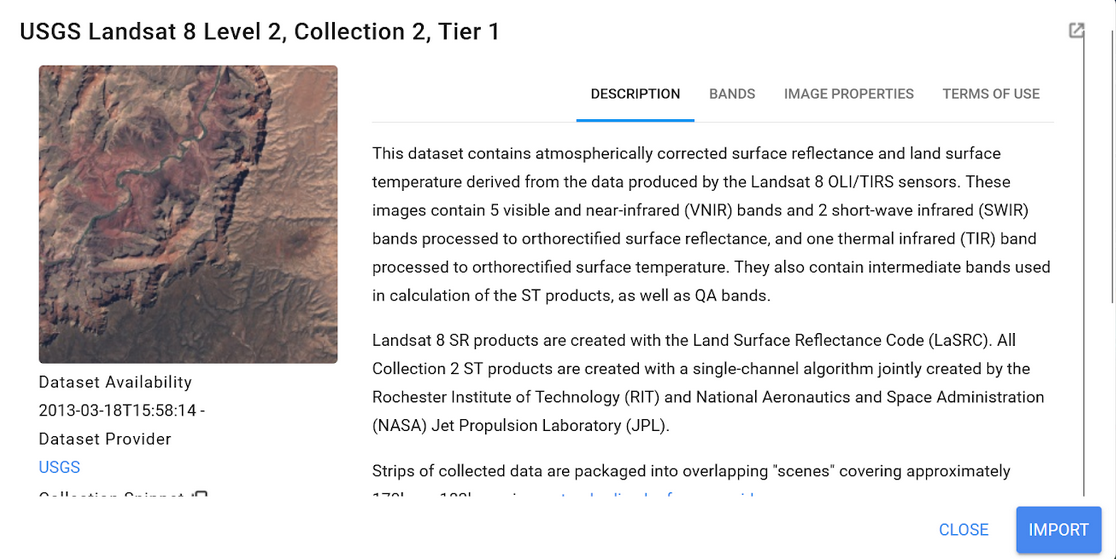
Figure 6. Landsat 8 description.
Lets hit the ‘Import’ button, and change the name of the collection to ‘landsat8_sr’. Now let’s download the boundary shapefile of Guyana. We are going to upload this file into the Assets section to have our country boundary available. First you can add a new project pressing the ADD A PROJECT button within the Assets section:
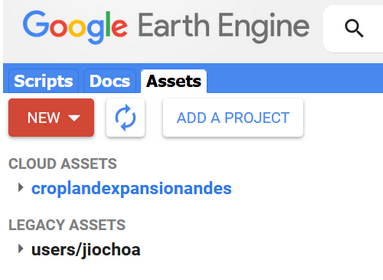
Figure 7. Adding a new project
You can provide a name or id for the new cloud project,and then press ‘Select’.
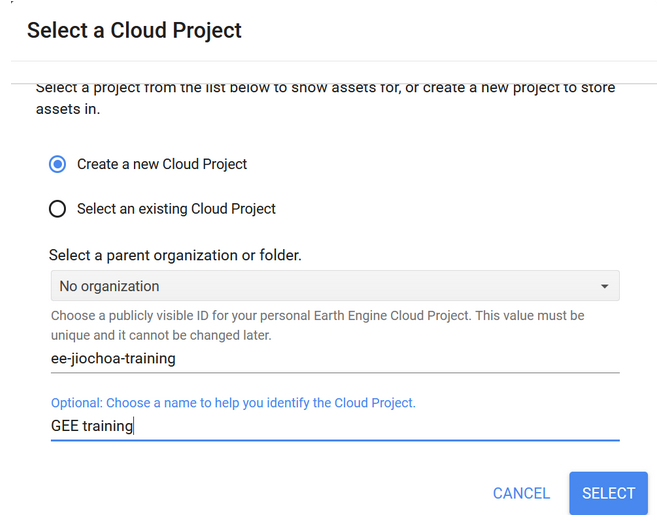
Figure 8. Cloud project set-up window.
Now press the New button and select the Shape files options within the Table Upload section.
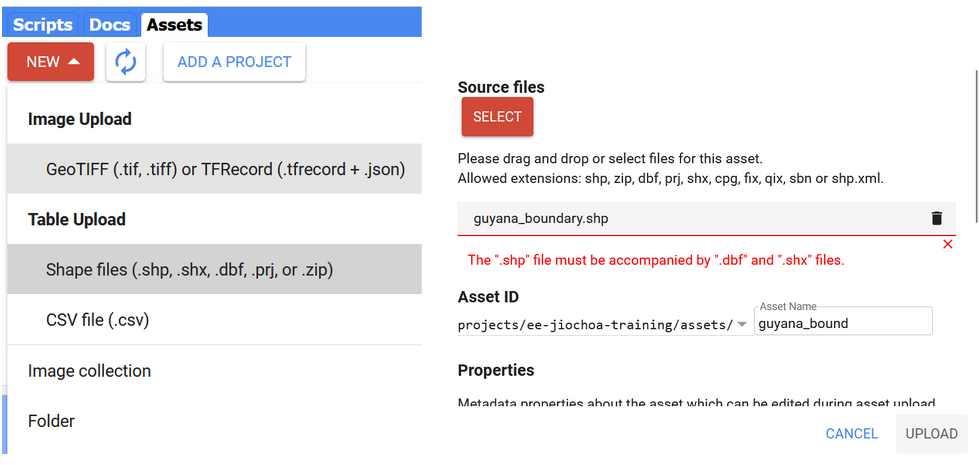
Figure 9. Uploading a new shapefile into the Assets.
When selecting the shapefile, make sure to select all of its components, but ignore the qpj file. For example, avoid errors like “The file named “guyana_boundary.qpj” does not have a correct extension” or “the shapefile must be accompanied by ‘dbf”
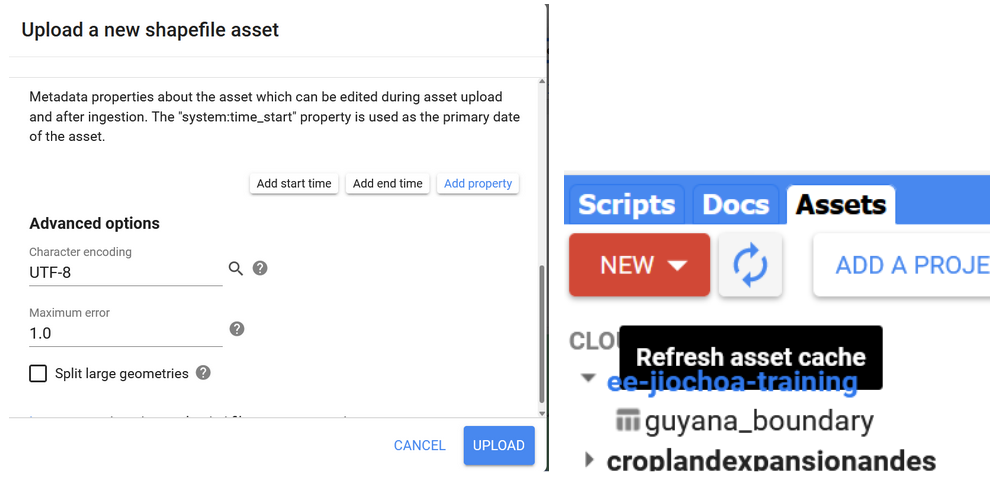
Figure 10. Shapefile properties.
The two-arrows icon permits us to refresh the view in case you don’t see the uploaded file. We click on the file name to open it:
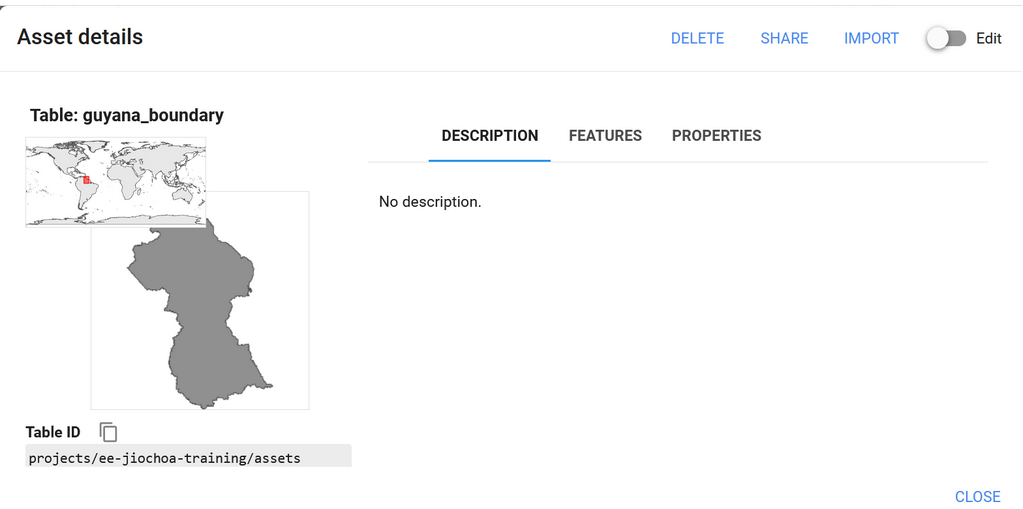
Figure 11. Shapefile loaded.
Click on ‘Import’ and change the name to guyana_bou. Now let’s work filtering our current image collection over three aspects: temporal, spatial, and spectral.
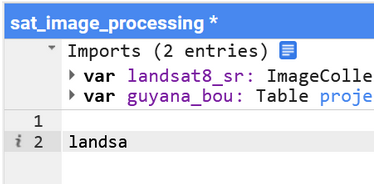
Figure 12. Typing an existent variable name
When typing you can press Ctrl + spacebar to autocomplete names of existent variables, or Ctrl + spacebar after inserting a point to observe a list of available functions
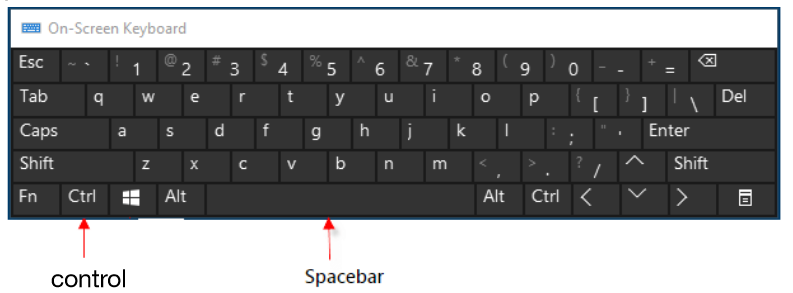
Figure 13. Keyboard shortcut
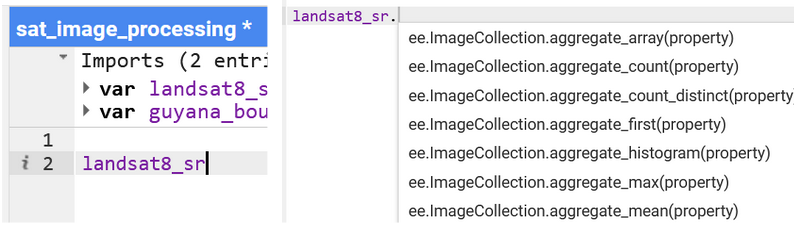
Figure 14. Available functions listed.
The following code selects 3 months of Landsat 8 imagery over Guyana territory. Immediately we apply a scale factor.
landsat8_sr = landsat8_sr
            	.filterDate('2022-10-01', '2022-12-31')
            	.filterBounds(guyana_bou)

// Applies scaling factors needed for Landsat collection 02
function applyScaleFactors(image) {
  var opticalBands = image.select('SR_B.').multiply(0.0000275).add(-0.2);
  var thermalBands = image.select('ST_B.*').multiply(0.00341802).add(149.0);
  return image.addBands(opticalBands, null, true)
          	.addBands(thermalBands, null, true);
}


landsat8_sr = landsat8_sr.map(applyScaleFactors);
We can also select only the required bands, e.g. excluding the first band of coastal aerosol.  The visualization setting must be described.

var visualization = {
  bands: ['SR_B4', 'SR_B3', 'SR_B2'],
  min: 0.0,
  max: 0.3,
};

Map.centerObject(guyana_bou, 6)

Now we visualize the layers created using the
Map.addLayer(guyana_bou, {}, 'guyana', 0)
Map.addLayer(landsat8_sr, visualization, 'True Color (432)');
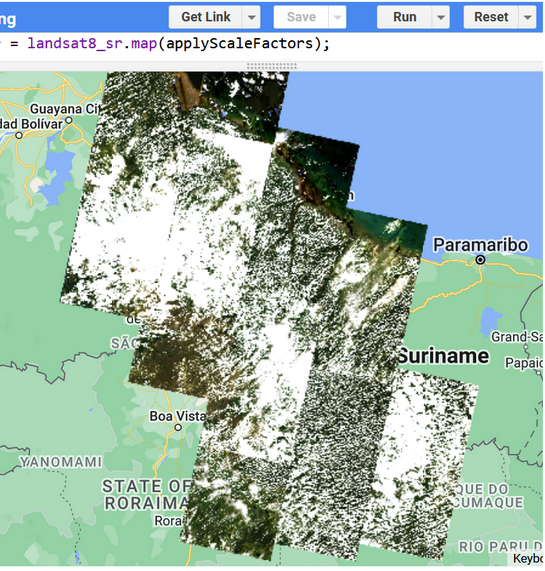
Figure 15. True color Landsat 8 collection 2 mosaic for Guyana.
We have added the layer of surface reflectance (SR) values for 3 months to visualize. You can check the code link at https://code.earthengine.google.com/c242421f3cc5229e8e24bd019b8f6ceb.