Introduction
Welcome to an Introduction to Synthetic Aperture Radar (SAR)! This workshop will give an overview of radar remote sensing with a particular focus on SAR imagery. It will explore some methods for accessing, opening, reading, and displaying SAR images and share techniques for processing and filtering these radar images. To start off, this section will cover a number of fundamental radar concepts and provide a snapshot of key sensor types.
Pre-workshop set-up
- Create an Earthdata account.
- Download SNAP software. Select the
Sentinel Toolboxes Main Downloadoption for your device type. - Create a folder called
intro-radar-dataon your Desktop.
Objectives
- Understand how radar remote sensing differs from optical remote sensing.
- List the advantages and disadvantages of radar remote sensing.
- Learn key facts about different radar sensor types.
What is RADAR?
As a recap, remote sensing is the process of gaining information about an object or an area without directly being in contact with that object. Sensors take advantage of the electromagnetic radiation reflected or emitted from the Earth’s surface to monitor and map changes to the surface of the Earth over time. Thus far, we have worked with remote sensing data that uses energy in the visible and infrared portion of the electromagnetic spectrum. RADAR, which is actually an acronym that stands for Radio Detection and Ranging, uses energy that falls within the microwave portion of the spectrum. These longer energy wavelengths equip radar data with a number of advantages over optical remote sensing data that we will explore throughout this section.
Pros and Cons of Radar
Let’s start with the positive: what can radar achieve that optical remote sensing cannot?
- “All-weather” monitoring. Microwaves can penetrate through cloud cover, fog, and smoke, which makes radars a more reliable and consistent source of imagery in any given location. A majority of the globe experiences at least 50% cloud cover during a year, so this increased monitoring ability is massively helpful. This advantage also creates an opportunity for better disaster and wildfire management.
- Day or night monitoring. Radar doesn’t rely on energy from the sun to take its measurements, so imagery can be captured during the day or at night.
- Vegetation and soil penetration. Microwaves can also penetrate through dense vegetation and soil, allowing the sensors to capture characteristics of the Earth that optical sensors cannot.
- Minimal atmospheric effects. Remember the many levels of processing optical remote sensing data must go through before it can be used? Radar data must also be pre-processed, but its longer wavelengths do not get affected by the same atmospheric conditions that can make optical imagery appear hazy or distorted.
- Dielectric and structural sensitivity. Radar data can pick up on the dielectric and structural properties of an object, which can make it easier to distinguish between liquid and frozen water, for instance.
![]()
Optical imagery (left) vs. radar imagery (right) of the Kliuchevskoi Volcano erupting. Source: Michigan Tech Volcanology
These advantages are very powerful, though there are always multiple sides to consider when selecting the correct type of data for your research project. Let’s examine some of the cons of radar data.
- Challenging interpretation. Unlike optical imagery, which most people can intuitively interpret as it appears very similar to a photograph taken with one’s cell phone, radar imagery is not as easy to understand immediately. It contains information about energy outside of the visible light spectrum, and so it often requires more training for a user to understand what they are looking at in a radar image.
- Speckling. Radar images often appear grainier than optical imagery.
- Topographical effects. Topography has a greater effect on radar imagery than optical imagery, as the terrain can reflect the energy radars measure and thus distort the image.
Given these advantages and disadvantages, let’s understand why they exist in the first place. The major driver behind these differences is the way the data is collected.
Data Collection
Passive vs. Active Measurements
This concept should sound familiar, as we briefly discussed it in the Introduction to Remote Sensing lesson. It is a key difference, however, so we will discuss it far more in depth here.
Optical sensors are called passive sensors because they rely solely on energy from an outside source (e.g, the sun) to capture their measurements. This reliance on outside energy sources limits these sensors by the effects of the atmosphere. Energy that is simply reflected from the surface of the Earth cannot penetrate things such as cloud cover or fog, and thus makes it difficult to gather data consistently in areas that experience this type of weather often.
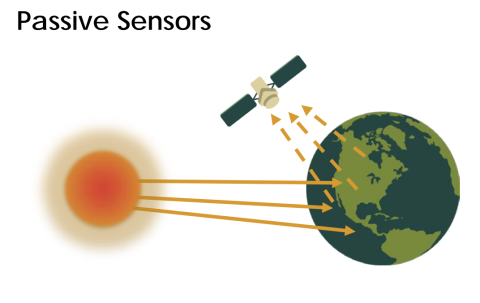
Diagram of passive remote sensing. Source: NASA Applied Remote Sensing Training Program
Radar is a form of active remote sensing. These sensors provide their own artificial source of energy for illumination of the Earth’s surface, which can get through clouds, vegetation, and even soil depending on the type of signal they send down. Radars measure the energy that is reflected back from its own signal to generate an image of the surface of the Earth.
Imaging radars are side-looking, which means they transmit energy at a 90 degree angle in order to differentiate between two objects on the ground. By transmitting energy at an angle, it allows energy to bounce off of objects on the ground and reach the radar at different times so that the two objects can be distinguished.
Side-looking radar. Source: Side looking airborne radar, Charly Whisky.
What do radars measure?
Radar components. There are four primary parts of a radar system that allow it to collect information:
- Transmitter. This device outputs short bursts of microwave energy at regularly scheduled intervals. (The “active” part of active remote sensing!)
- Antennae. The antennae focuses the series of pulses from the radar into a beam that illuminates the surface at a right angle to the motion of the platform.
- Receiver. The antennae receives the energy that is reflected, or backscattered, from the Earth’s surface. The time at which the energy is received by the antennae allows the system to pinpoint the location of the object it reflected off of.
- Electronic processing system. This system processes the backscattered signal to generate an image.
In addition to the time at which the signal is received, which is referred to as the phase (a point in time in the position of the waveform) of the signal, radars also measure the amplitude (strength) of the reflected signal. Amplitude is called the backscatter coefficient, or $\sigma_{0}$, and is expressed as the fraction of the energy that is backscattered to the radar per unit target area. The value is measured in decibels (dB) and can range from around -25 dB (very little energy reflected back) to 1 dB (high amount of energy reflected back.
What is SAR?
Radars possess two types of resolution: (1) Range (across track) resolution defines the ability of the radar to distinguish between two targets perpendicular to the path of the sensor that are close in range. This type of resolution is determined by length of pulse sent out by the transmitter. (2) Azimuth (along-track) resolution defines the ability of the radar to distinguish between two objects parallel to the path of the sensor that are close together. This resolution is determined by the beam length, which is inversely proportional to the length of the antennae, or aperture.
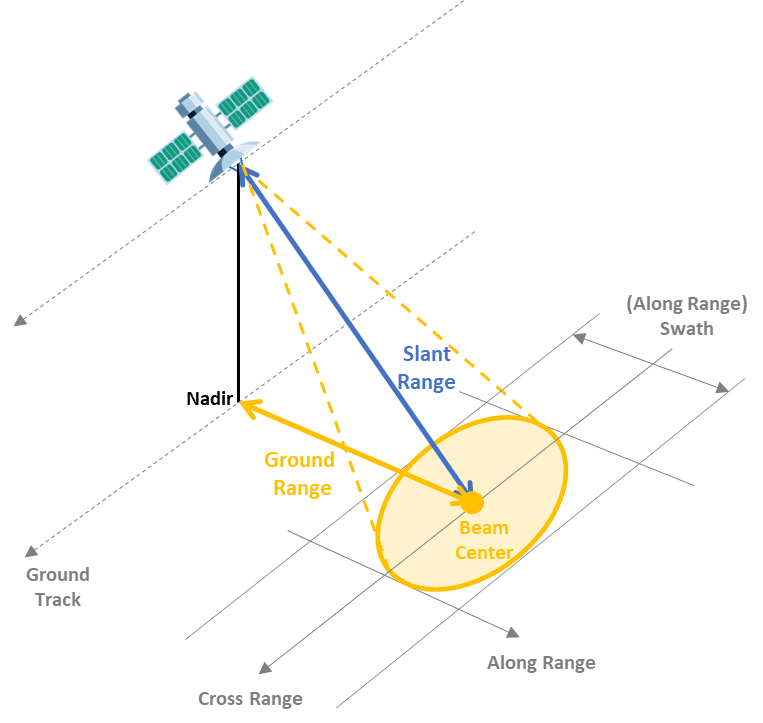
SAR resolution. Source: MathWorks
A longer antennae, then, results in a narrower beam and thus finer resolution. Sending extremely long antennas out into space, however, is highly unrealistic. Instead, scientists leveraged the Doppler shift associated with the motion of the aircraft to simulate a very long antennae. This simulation creates a “synthetic aperture.” Synthetic aperture radar, or SAR, is able to generate higher resolution images compared to the actual length of the antennae.
Choosing the Right Type of Radar
There are plenty of different characteristics that distinguish sensors from each other, but the three most common factors to consider are listed below.
Wavelength. The length of the wave really determines how the beam will interact with the surface of the Earth, and thus what type of information you can ascertain from the image. The most significant aspect it affects is how far the beam can penetrate the surface. Longer wavelengths can penetrate through forest canopy or soil more effectively. The table below shows the different wavelength bands used, the name for each one, and some common applications. Note that the names of the wavelength bands are somewhat random and hard to follow – this is on purpose! For a long time radar data was used only by the military, so they selected names for the bands to hinder anyone from figuring out what each band represented.
| Band | Wavelength (cm) | Application |
|---|---|---|
| Ka | 0.8 to 1.1 | high resolution data |
| K | 1.1 to 1.7 | |
| Ku | 1.7 to 2.4 | glaciology, snow cover mapping |
| X | 2.4 to 3.8 | agriculture, ocean, high resolution data |
| C | 3.8 to 7.5 | ocean, agriculture |
| S | 7.5 to 15.0 | |
| L | 15.0 to 30.0 | agriculture, forestry, soil moisture |
| P | 30.0 to 100.0 | biomass, soil moisture, penetration |
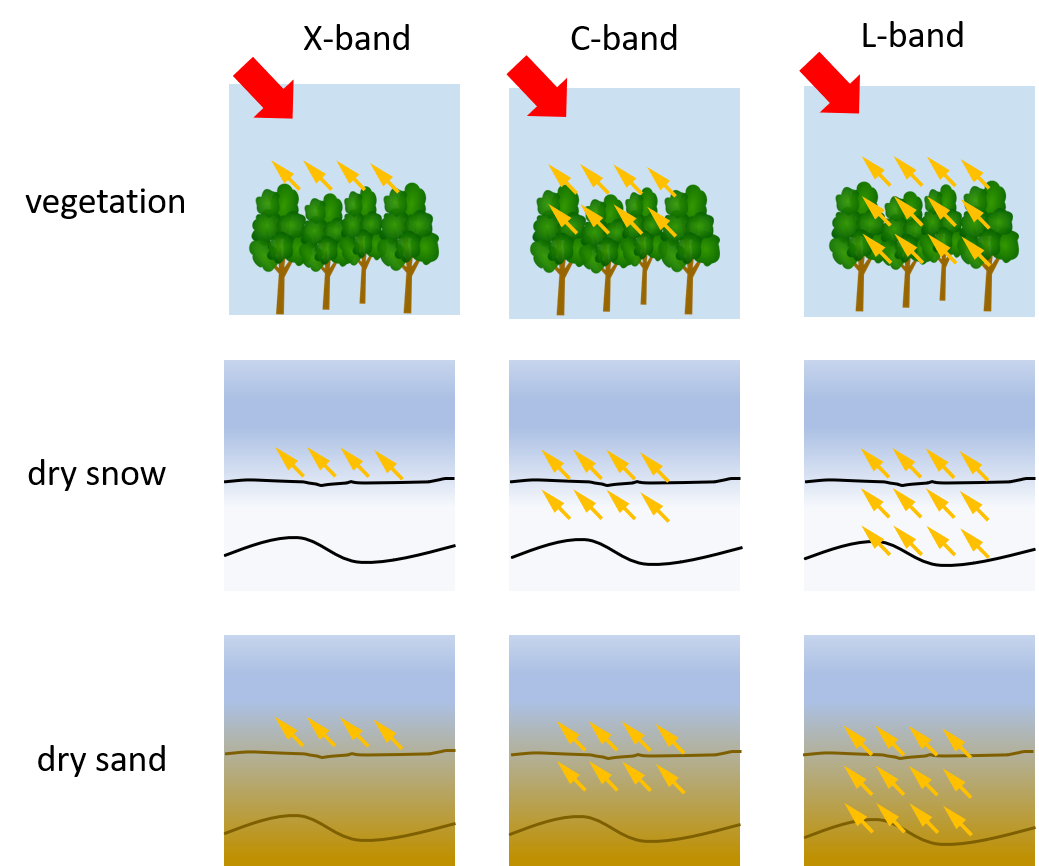
Surface penetration based on wavelength. Source: SAR 101: An Introduction to Synthetic Aperture Radar, Daniel Hogan
Polarization. Radar signals are polarized and usually denoted as horizontal (H), or vertical (V). These polarizations affect the way that the signal is both transmitted and received and the physical properties of an object that are detected. There are four typical polarization combinations:
- HH: horizontal transmit, horizontal receive
- VV: vertical transmit, vertical receive
- HV: horizontal transmit, vertical receive
- VH: vertical transmit, horizontal receive
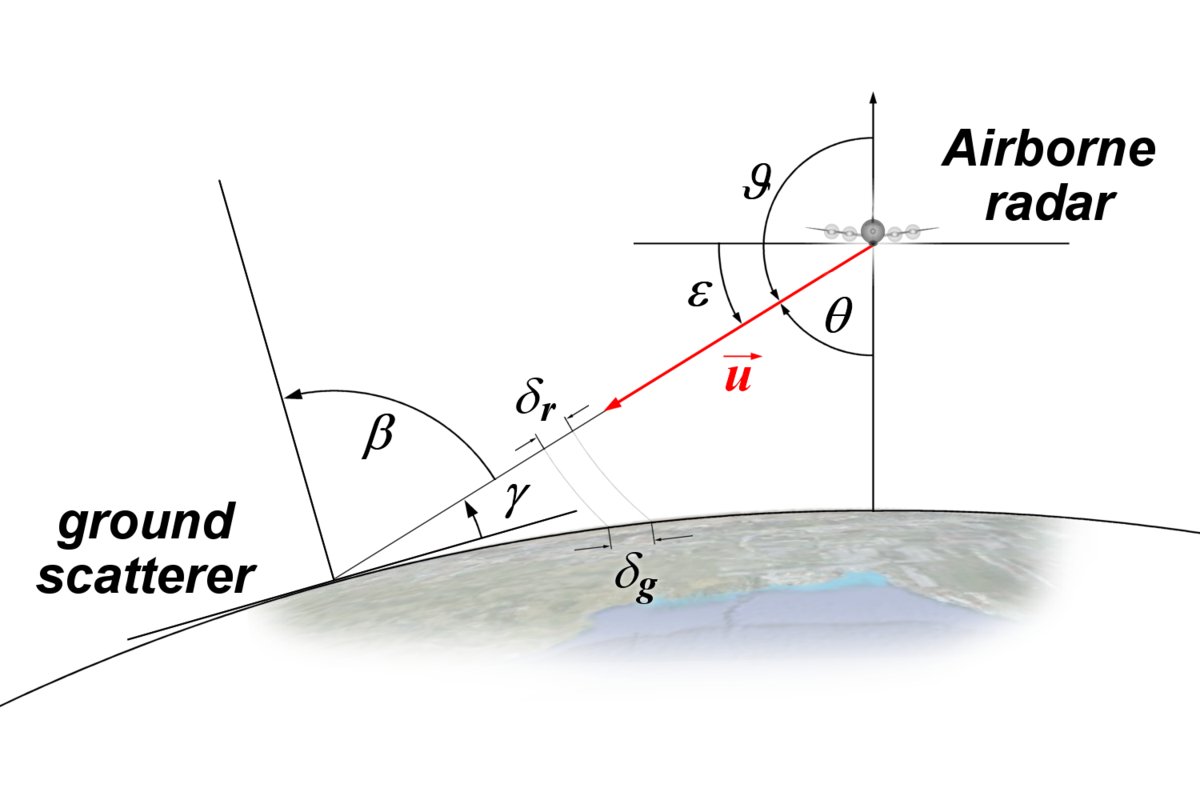
Incidence angle. The final factor to consider is the incidence angle, θ, which is the angle between the direction of the radar beam and the plan perpendicular to the surface of the Earth.
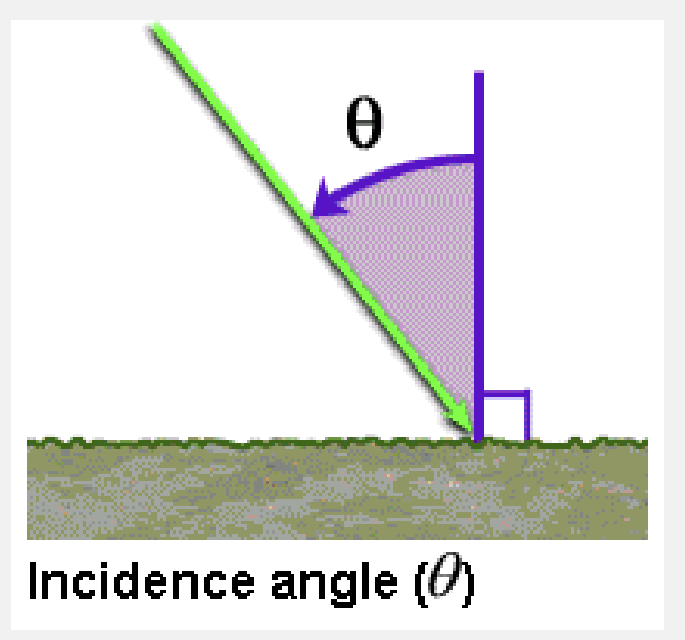
Incidence angle. Source: NASA Applied Remote Sensing Training Program
The larger the incidence angle, the greater the sensitivity to surface roughness. These beams will be able to penetrate less deep than beams that have smaller incidence angles, and also result in lower levels of backscatter.
Surface Effects
The factors we discussed above are all radar properties that will affect the backscatter received by the radar. There are also surface properties that have an effect on the backscatter. The combination of these effects makes an impact on the data the sensor collects, and thus the data provides information on the following two surface parameters.
Surface roughness. Surface roughness is defined as the average height variations in the surface cover on the order of centimeters. This factor has the primary impact on the tones of a radar image and level of backscattering. Smooth surfaces, or surfaces where the variations in height are much smaller than the radar wavelength, appear darker in radar images while rough surfaces appear lighter. This difference is due to the type of backscattering mechanism that the type of surface triggers. There are four primary types of backscattering:
- Specular reflection. Smooth surfaces tend to reflect all of the energy away from the radar. These areas appear very dark in radar images. Ex: open water
- Diffuse reflection. Rough surfaces, where the level of roughness approaches the length of the microwave, start to reflect some of the energy back to the radar. These areas appear somewhat brighter. Ex: rocky open areas, grasslands.
- Double bounce reflection. This type of reflection occurs when energy bounces off a smoother surface and then bounces again on a nearby, vertical object so that most of the energy scatters back to the radar. These areas appear very bright. Ex: urban areas, inundation
- Volume scattering. This type of scattering occurs within a volume or medium. Energy bounces of a number of different elements within the medium to cause wide amounts of scattering, some of which returns to the radar. The brightness can vary, but is usually moderately bright. Ex: snowpack, forests.
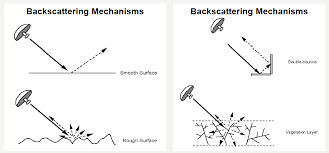
Backscattering mechanisms. Source: Advantages and Applications of Synthetic Aperture Radar as a Decision Support Tool, Molthan et al., NASA
Dielectric properties. The dielectric properties of a material have a big effect on the surface’s ability to absorb or reflect microwaves – so much so that the magnitude of the backscatter is proportional to the dielectric constant of the surface. Liquid water has a much higher dielectric constant than other materials including frozen water (a dielectric constant of 80 compared to a range of 0-10), and so the presence or absence of water defines a surface’s dielectric properties. For the most part, surfaces with high dielectric constants have higher reflectivity and thus appear brighter than those with lower dielectric constants.
Radar Instruments
| Radar System | Band | Wavelength (cm) | Spatial Resolution (m) | Temporal Resolution (days) | Timeframe | Provider |
|---|---|---|---|---|---|---|
| BIOMASS | P | ~69.0 | 3 | Launch 2024 | ESA | |
| ALOS-2 PALSAR-2 | L | ~23.5 | 3-10 | 14 | 2014 - present | JAXA |
| NISAR-L | L | ~23.5 | 3-10 | 12 | Launch 2024 | NASA/ISRO |
| NISAR-S | S | ~9.4 | 3-10 | 12 | Launch 2024 | NASA/ISRO |
| Sentinel-1 | C | ~5.6 | 25-800 | 6 | 2014 - present (1A), 2016 - present (1B) | ESA |
| Radarsat-2 | C | ~5.6 | 3-100 | 1 | 2007 - present | CSA |
| TerraSAR-X | X | ~3.1 | 1-5m | 11-22 days | 2007 - present | ADS/DLR |